Setting up basic analytics with Django & Chart.js
We recently made the decision to enhance our vehicle selling platform by introducing a new search function. This feature allows consumers to locate dealerships in their vicinity by using unique metrics extracted from their past inventory data, such as average prices and models, among others.
To implement this new feature, we had to venture into front-end charting, which was a new area for us. Although our django / python backend has been dependable for various features we have developed, our team's experience with JavaScript is considerably limited.
As a result, we were cautious about exploring complex JavaScript options or libraries that required significant setup efforts during our search for the ideal charting tool. Some of the alternatives we evaluated included:
- Recharts
- CanvasJS
- C3.js
In the end, our choice for a charting library was Chart.js, mainly because of its several key advantages. Firstly, its minimal setup cost allowed us to experiment with its features with ease and speed.
Secondly, it has a wide adoption across multiple platforms, with well-organized and comprehensive documentation and support. It can be frustrating to adopt a new library that is challenging to understand or has inadequate documentation.
Initially, we were apprehensive about incorporating a JavaScript-only library, but integrating Chart.js with our django platform turned out to be a breeze.
To get started, all that is required is adding the Chart.js package to the page where charts need to be displayed:
<script src="https://cdn.jsdelivr.net/npm/chart.js"></script>
It's worth noting that there is a possibility to include a charting library directly into your python environment using "pip install django-charts". However, for the sake of convenience and simplicity, we opted to add the script library to our essential pages.
After adding the script, generating charts is straightforward with the use of simple constructor calls.
We had our 'x-axis' data in a dictionary key accessed with:
inventory.new.models.items.model
We had our 'y-axis' data in a dictionary key accessed with:
inventory.new.models.items.num
To generate the chart we simply use django templating to loop through the dictionaries in the chart instantiation script.
<script async>
        const ctx = document.getElementById('newInventoryChart');

        new Chart(ctx, {
            type: 'bar',
            data: {
              labels: [
                    {% for model, num in inventory.new.models.items %}'{{ model }}',{% endfor %}
                ],
              datasets: [{
                label: '# of Vehicles in stock',
                data: [
                    {% for model, num in inventory.new.models.items %}{{ num }},{% endfor %}
                ],
                borderWidth: 1,
                backgroundColor: '#17428f'
              }]
            },
            options: {
              scales: {
                y: {
                  beginAtZero: true
                }
              },
              aspectRatio: 1
            }
        });
</script>
Once you've done this, you're pretty much done. All you need to do is ensure you have an html tag somewhere that matches the 'id' that you used in the chart constructor. Chart.js will automatically take care of generating the visual for you on page load.
For now, we have a mix of charts and basic metrics for each dealership, but plan to expand the single-point metrics into over-time charting with the library. For instance, Bayway Chevrolet below shows the average price, most popular model, and number of vehicles sold across both the new and used car departments.
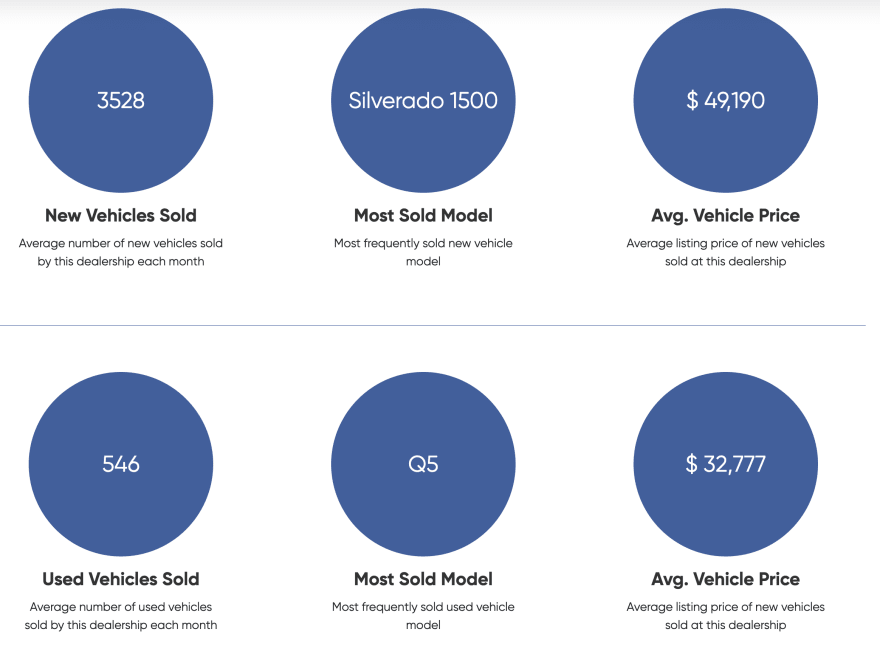
Our goal is to incorporate the ability to generate new charts dynamically based on user input. For instance, if the user is searching for Silverados, they can filter by model and receive comprehensive metrics for that specific vehicle, such as pricing variations, popular features, and cost of ownership.
Since it is relatively time-consuming to add all possible charts in the initial template, we plan to develop additional REST APIs that will enable the front-end to retrieve new chart data as needed.
We hope this information is useful to anyone who is considering incorporating Chart.js into their Django application, and we are available to address any questions or concerns you may have in the comments. As previously stated, getting started with Chart.js is simple, and you don't need to be a JS expert to use it!
Comments
Post a Comment